
More Points Wins
More Points Wins is the result of my attempt to find the statistic that best predicts a football team's record.
This page gives the background information first and the conclusion at the end. If you just want to know how it works, not why I decided to do it that way, just scroll to the end of this page (or jump right to it).
To compare MPW to other prediction methods, go to the Formula Tracker page.
Background
I started by looking at all the stats found at the NFL's website (Stats - Team Stats - NFL Team Rankings - Game Stats)
There, you get to see Points Per Game, Total Points, Scrimmage Plays, Yards Per Game, Yards Per Play, 1st Downs Per Game, 3rd Downs Made, 3rd Downs Attempted, 3rd Down Conversion Percent, 4th Downs Made, 4th Downs Attempted, 4th Down Conversion Percent, Number of Penalties, Total Penalty Yards, Penalty Yards Per Game, Fumbles, Fumbles Lost, and Turnover Margin
I gathered the information from the 2008 season (regular season only) and graphed each statistic. The stat used the Y axis, and the X axis was for team's winning percentage. That was expected to show any correlation between winning and a given statistic.
I did not use every stat. I skipped the Made and Attempted columns and used only the Conversion Percent for 3rd and 4th downs. Same with Fumbles and Fumbles Lost in favor of Turnover Margin.
The NFL separates the stats into Offense and Defense, so I did the same - graphing offense and defense separately.
| Offensive Stat Graphs | Defensive Stat Graphs |
|---|---|
 |
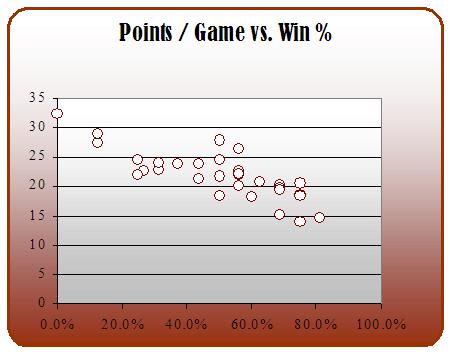 |
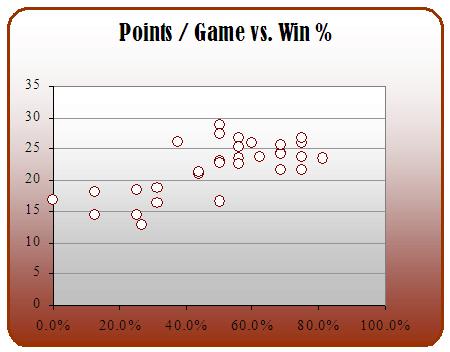
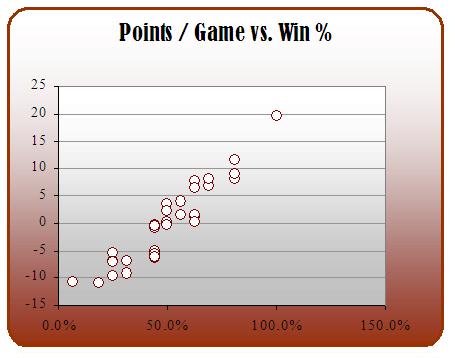
| This shows somewhat of a correlation. You would expect that the more points a team scores, the more likely it is to win. | This shows a little better correlation. You would expect that the fewer points a team allows, the more likely it is to win. |
 |
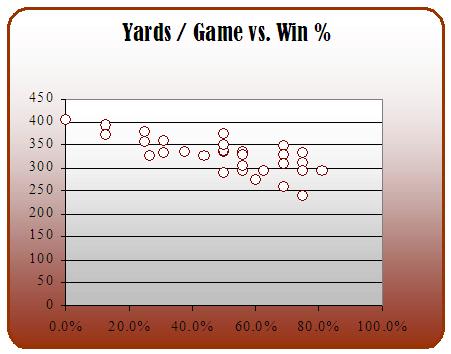 |
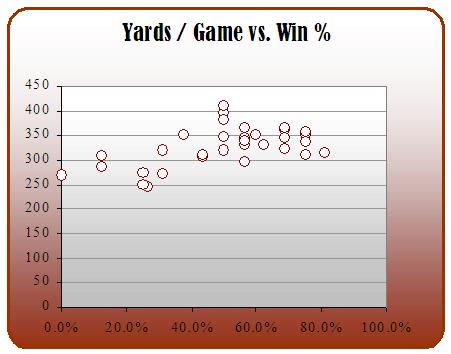
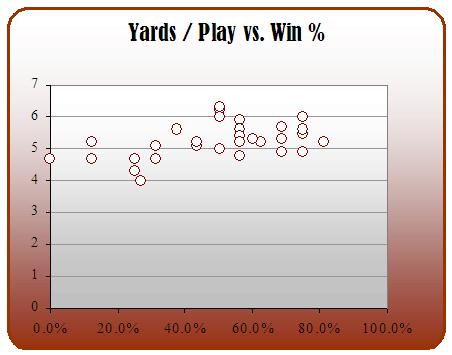
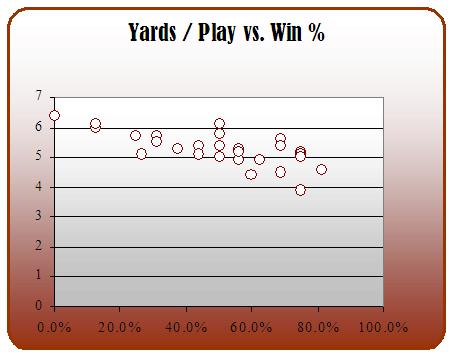
| This also shows a slight correlation. More yards, in general, should mean more points. | This also shows a slight correlation. Fewer yards, in general, should mean fewer points. |
 |
 |
| This also shows a slight correlation. More yards, in general, should mean more points. | This also shows a slight correlation. Fewer yards, in general, should mean fewer points. |
 |
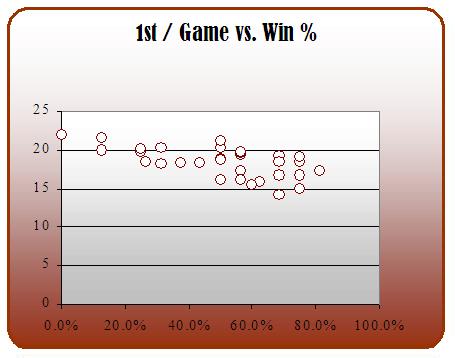 |
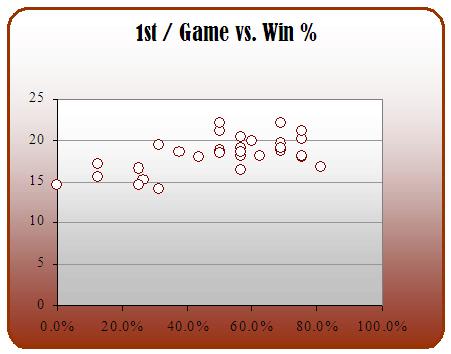
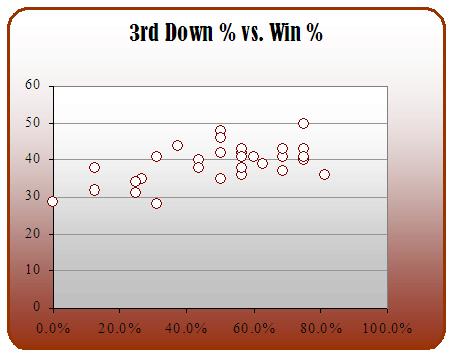
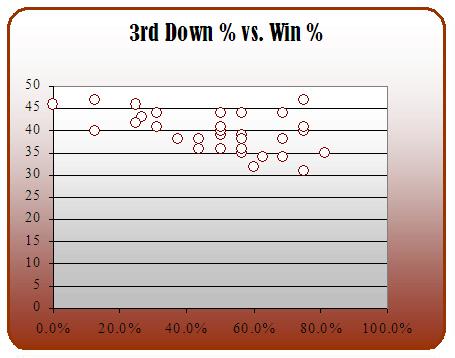
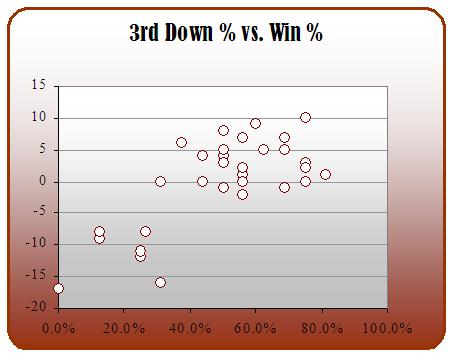
| This also shows a slight correlation. An offense that is progressing down the field should have first downs to show for that effort. | This also shows a slight correlation. A defense that is stopping the other team should mean the other team has fewer first downs to show for that effort. |
 |
 |
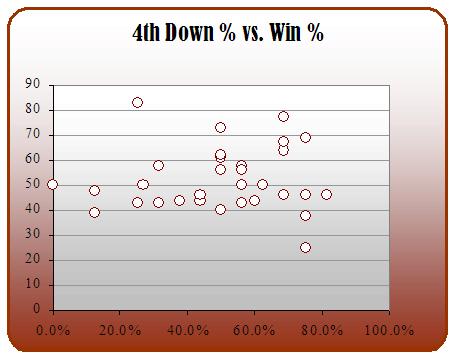
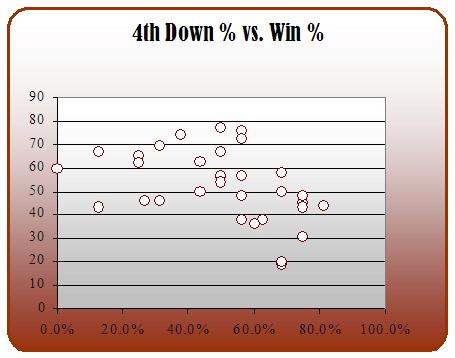
| This is similar to the first downs graph. | This is also similar to the first downs graph, but a little noisier. |
 |
 |
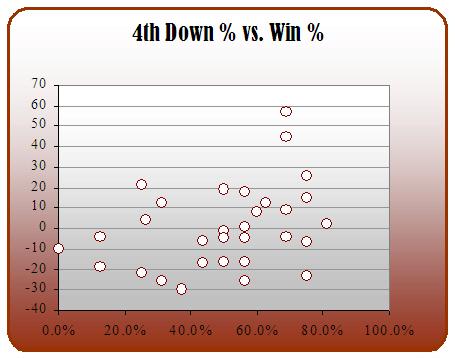
| I don't know what this one shows. | There may be a vague correlation here, but I wouldn't use it for much. |
 |
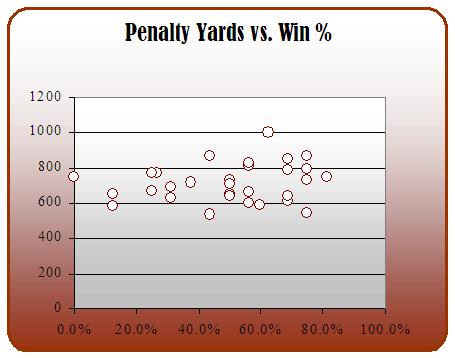 |
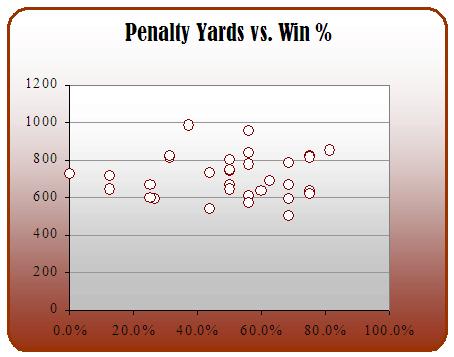
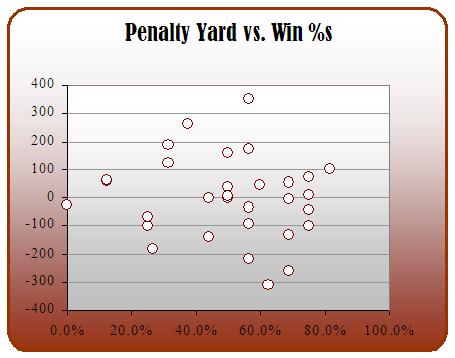
| I thought a well-disciplined team might play better than a careless one. Apparently, your penalty yardage doesn't really matter. | Penalties by the defense don't matter much either. |
 |
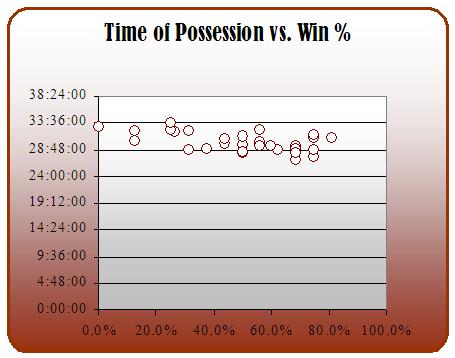 |
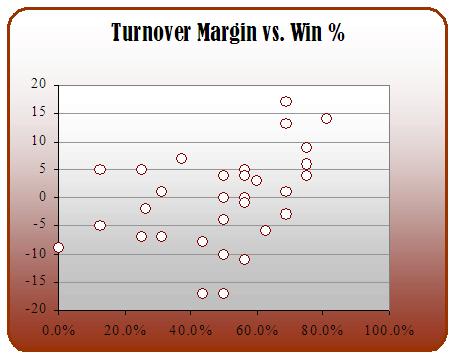
| I had better expectations for this one. Wouldn't a team that's playing better have fewer turnovers? But I don't see much of any correlation here. Sure, the first and last place teams are in the right spots, but everything else is all over the graph. | I decided that Turnover Margin for defense would be just the opposite of the offense's number so it would be pointless to graph it here. Time Of Possession is a similar stat (defense is just the opposite of offense), so any correlation here would apply to the team. But there is not much correlation to be had. |
The defense graphs show a better correlation than the offensive graphs. The graph of the ideal stat would be a diagonal (45 degrees or π/4 radians) line such as / for offense or \ for defense.
Because the offense's graphs are closer to 0 degrees than are the defense's graphs, that tells me that defense is more important to a team's record than is offense. I am not going to try to quantify how much more important it is. That is left as an exercise for the reader.
Stat Improvement
After reviewing the graphs, I realized that teams with a lot of points don't necessary win and teams with few points don't necessarily lose. It depends how the team scores relative to the other team.
So I updated the graphs to show offensive stats minus defense stats.
| Offensive Stat Minus Defensive Stat Graphs |
|---|
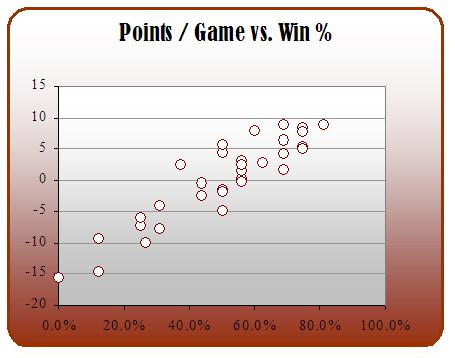 |
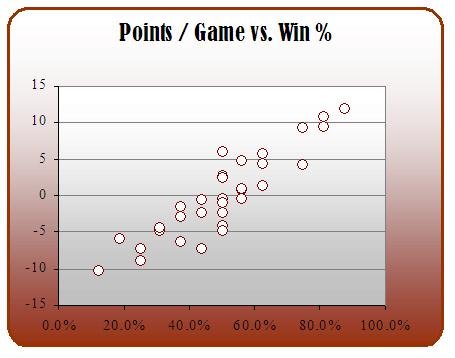
| This shows a very nice correlation. This is about as good as you could expect. This shows that the worst team (2008 Lions by the way) allowed, on average, 15 more points than they scored. And the best team scored almost 10 points more than their opponent. This stat is a keeper. |
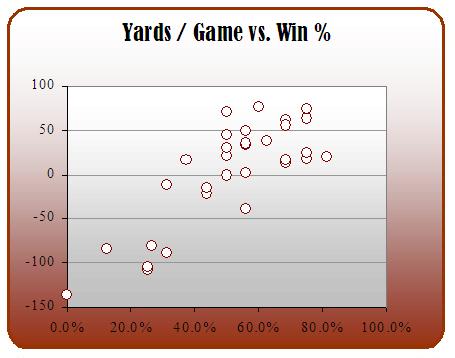 |
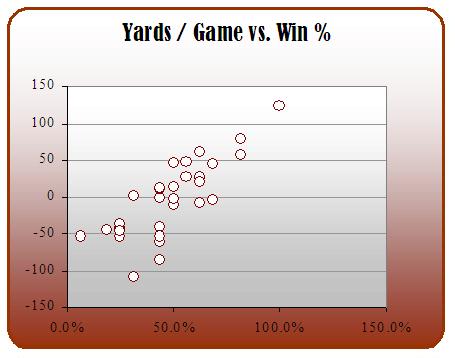
| This also shows a good correlation, but it's not as nice because of the scattering. The data points should be closer to the imaginary line from worst to first. But overall, not too shabby. |
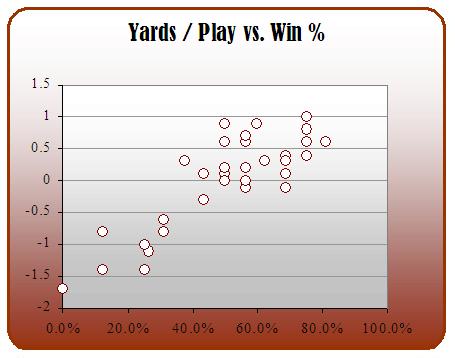 |
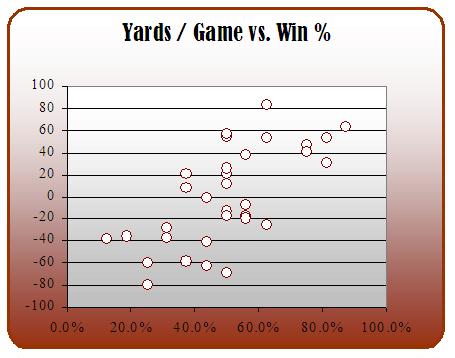
| Same as above. Use this one or the other one. |
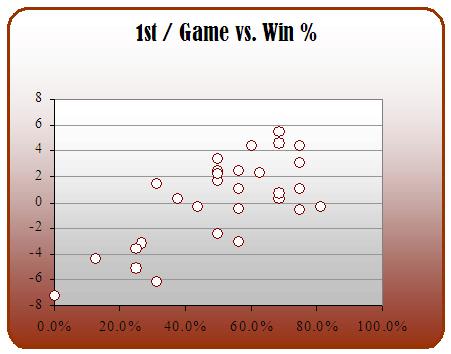 |
| This one would be the same as the previous one but for the best team. That throws off the curve-fitting. I don't like it. |
 |
| Same as above. |
 |
| This one was so scattered, I spent more time wondering what drawing would result if I connected the dots than I spent considering it for anything useful. |
 |
| The team with the most penalty yards and the team with the fewest penalty yards both had about a 60% winning record. That doesn't help me decide anything. Furthermore, it should be offensive plus defense penalty yards, but I'm not going back and fixing this one. |
It looks like the NFL is already aware of the correlation, as they have put the stats in the order of best correlation to worst correlation.
Whether that's true or not, I'll be using Points Per Game as the method of predicting a game's outcome.
To verify that the method of using points difference and yards difference is valid, I setup graphs for a couple more years. It looks pretty consistent.
| 2007 Stat Graphs | 2006 Stat Graphs |
|---|---|
 |
 |
| Good | Still good |
 |
 |
| Still good | Slightly questionable, but good |
The Method

More Points Wins works like this: the team with the higher average points difference is the team that will win. If two teams have the same points difference, then the team with the higher yards per game difference is the team that will win.
Average points difference is the offensive points per game (average points scored) minus the defensive points per game (points allowed). Average yards difference is the offensive yards per game (average yards gained) minus the defensive yards per game (yards allowed).
What about the first game of the season, when no one has any average points or average yards?
I'm glad you asked. I used the averages from the end of the previous season (regular season only).
And that's it.